Understanding the Infographics Industry: A Comprehensive Guide
What Are Infographics?
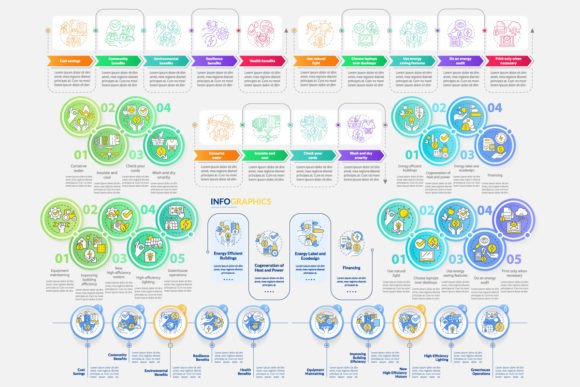
Infographics are visual representations of information, data, or knowledge intended to present complex information quickly and clearly. They combine text, images, charts, and other graphic elements to convey a message in a visually appealing and easily digestible format.
The Purpose and Significance of Infographics
Infographics serve multiple purposes, including:
- Educational Value: They help simplify complex topics, making them easier to understand and remember.
- Data Visualization: They transform raw data into visually engaging and understandable formats.
- Engagement: They capture the audience's attention more effectively than plain text, increasing engagement and retention.
- Storytelling: They can tell a story or explain a process in a compelling way, enhancing the narrative.
Types of Infographics
There are several types of infographics, each suited for different purposes:
- Statistical Infographics: These focus on presenting data and statistics in a visually appealing way, often using charts and graphs.
- Informational Infographics: These provide detailed information on a specific topic, often breaking it down into easy-to-understand segments.
- Timeline Infographics: These illustrate a sequence of events or a historical progression, helping to visualize the passage of time.
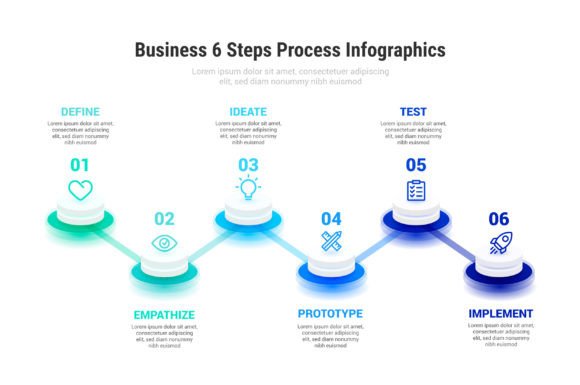
- Process Infographics: These break down a process or a series of steps, making it easier to follow and understand.
- Comparison Infographics: These compare two or more items, highlighting their similarities and differences.
The Role of Vector Illustrations in Infographics
Vector illustrations play a crucial role in the creation of high-quality infographics. Unlike raster graphics, vector graphics are resolution-independent, meaning they can be scaled up or down without losing quality. This makes them ideal for infographics that may need to be displayed in various sizes and formats.
Benefits of Using Vector Illustrations
- Scalability: Vector graphics can be resized without losing clarity, making them perfect for both small web graphics and large print materials.
- Editability: Vectors can be easily edited and modified, allowing for quick updates and changes.
- Consistency: Vector illustrations maintain consistent style and quality, ensuring a professional and polished look.
Creating Effective Infographics
To create an effective infographic, consider the following steps:
- Define the Purpose: Clearly define what you want to achieve with your infographic. Is it to educate, inform, or persuade?
- Research and Gather Data: Collect accurate and relevant data from reliable sources. Ensure the data is up-to-date and credible.
- Choose the Right Type: Select the type of infographic that best suits your purpose, whether it's statistical, informational, or another type.
- Design with Clarity: Use a clean and simple design. Avoid clutter and ensure that the most important information stands out.
- Use Visual Hierarchy: Organize the elements in a logical order, guiding the viewer's eye through the infographic.
- Test and Iterate: Share your infographic with a small group of people to get feedback and make necessary adjustments.
Common Misunderstandings About Infographics
While infographics are powerful tools, there are some common misunderstandings:
- Overloading with Information: Some creators try to include too much information, which can overwhelm the viewer. Keep it simple and focused.
- Poor Design Choices: Using low-quality graphics or poor color choices can detract from the message. Invest in good design and use colors that complement each other.
- Lack of Accuracy: Using inaccurate or outdated data can undermine the credibility of the infographic. Always verify your sources.
Infographics in Modern Life
Infographics have become an integral part of modern life, used in various fields such as:
- Business: Companies use infographics to present financial reports, market trends, and product features.
- Education: Teachers and educators use infographics to help students understand complex concepts and retain information.
- Healthcare: Healthcare providers use infographics to communicate health information, treatment options, and patient care instructions.
- Media and Journalism: News outlets and journalists use infographics to present data-driven stories and highlight key points.
Conclusion
Infographics are a powerful tool for communication, education, and storytelling. By understanding their purpose, types, and best practices, you can create visually appealing and effective infographics that engage and inform your audience. Whether you are a business professional, educator, or content creator, incorporating infographics into your work can enhance your message and make a lasting impact.